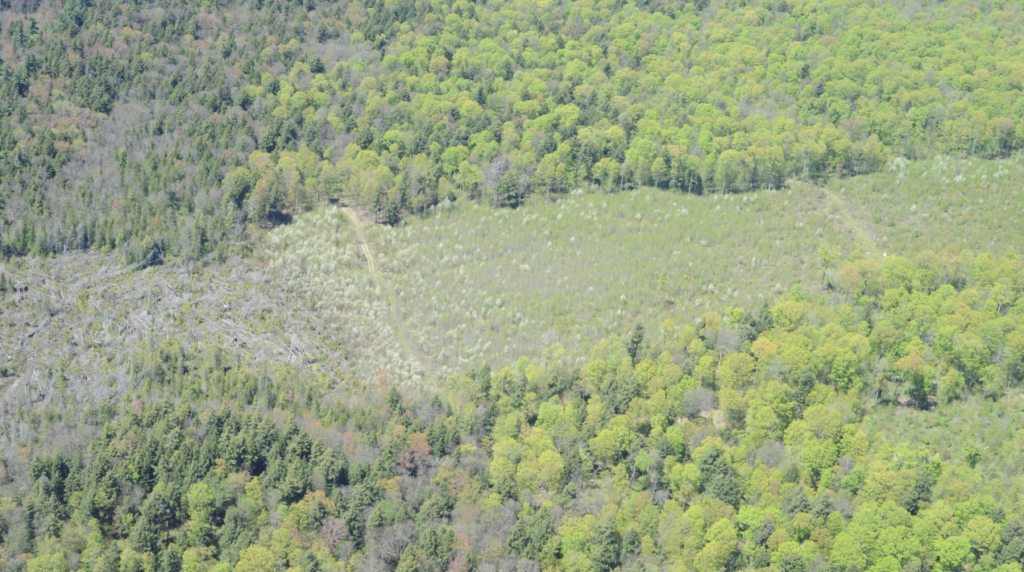
 Forestry is the backbone of the Menominee Indian Tribe of Wisconsin’s economy. For 150 years, Menominee Tribal Enterprises (MTE) has managed the Tribe’s 235,000 acres and has become an industry leader in sustainable forestry. In 2007, a tornado destroyed over 2,200 acres of prime hardwood forest, creating a massive impact on future revenue.
MTE was able salvage a significant amount of lumber — 14 million board feet of saw timber and 56,000 cords of pulp 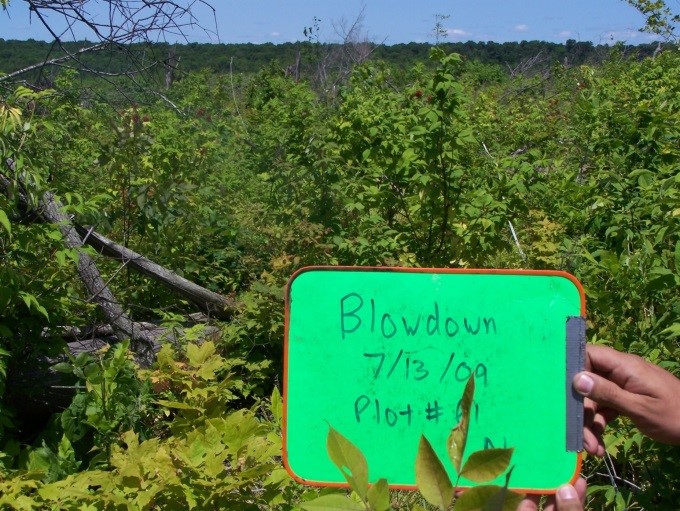 wood. The long-term management of the forest in that area was greatly affected as the site was essentially reduced to a blank slate. MTE meticulously manages its lands for a heathy and diverse forest on a long-term, sustainable basis. Practically every merchantable tree in the tornado’s path was gone. MTE’s foresters needed completely new plans on how to manage the young forest which would re-emerge. They waited several years to see what would occur naturally with the regenerating forest. They needed to understand both what was naturally regenerating and where it would be best to replant. However, 10 years after the salvage operation, the land is covered with thick brush, small densely packed trees, thorns, and significant down wood that was not merchantable during the salvage. These conditions made traditional field inventory difficult due to limited visibility and walking hazards from the thick cover and terrain.
Having worked with Ayres Associates for similar projects, MTE asked Ayres if there was an aerial solution to economically estimate what was naturally regenerating at the site. Remote sensing, a practice of obtaining information without touching it, has long been used to monitor and assess the environment in remote or difficult locations. But this project site presented challenges to standard remote sensing methods.
The site contained young trees, with crowns still only a few feet in diameter, and natural clusters of species heavily mixed. Readily available satellite data such as LandSat, often used in wide-area remote sensing applications, would not work for this environment. Its 30-meter pixel resolution is simply too large to analyze single trees and small stands. Hyperspectral sensors can provide more granular data and provide 100s of bands of data for extremely detailed analysis, but their cost would’ve exceeded the project budget.
By narrowing the scope to only identify a few select classes of land cover, 4-band imagery, (red, green, blue, and 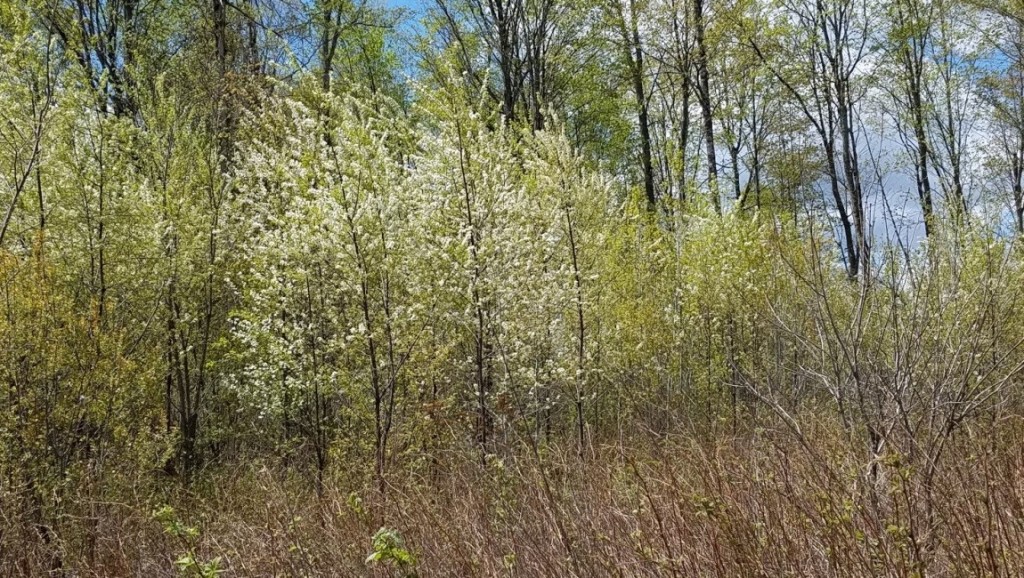 color infrared) could pinpoint key species at a much lower cost than hyperspectral data or a full field inventory. The key would be to collect two sets aerial imagery, each timed specifically to capture data when a specific species would have a unique spectral signature. Combined with an extensive set of sample data collected from the ground, the aerial data could be compared to identify types of vegetation. In this case, we targeted peak fall colors for aspen, and a mid-spring flight to capture pin cherries at their peak bloom.
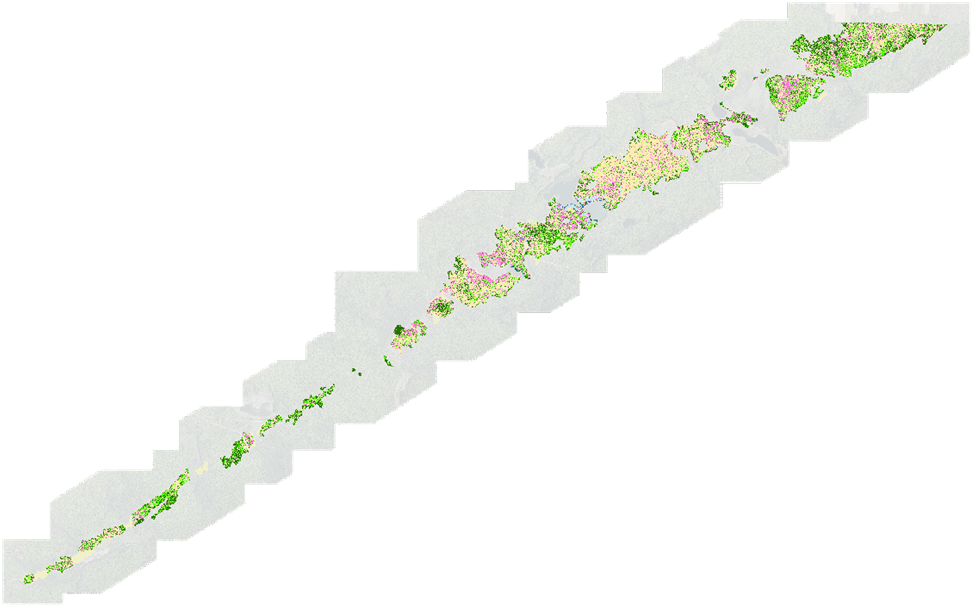
Ayres Associates, working in conjunction with our ecological partners at AES, analzed the data to map aspen, pin cherry, hardwoods, and dead wood, as well as open lands and water. After collecting the data,we began ourprocess by using segmentation techniques to examine each pixel in an image and compare it to adjacent pixels similar in spectral signature and shapes of groups. Our team then performed supervised classification on these groups of pixels using the sample sites from the field to classify the entire project area.
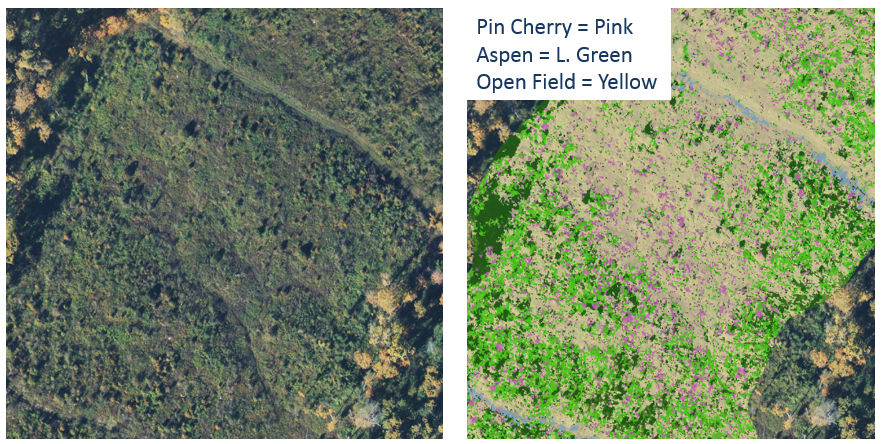
In these images you can see areas identified as pin cherry mixed with hardwoods as well as where areas of dead wood remain.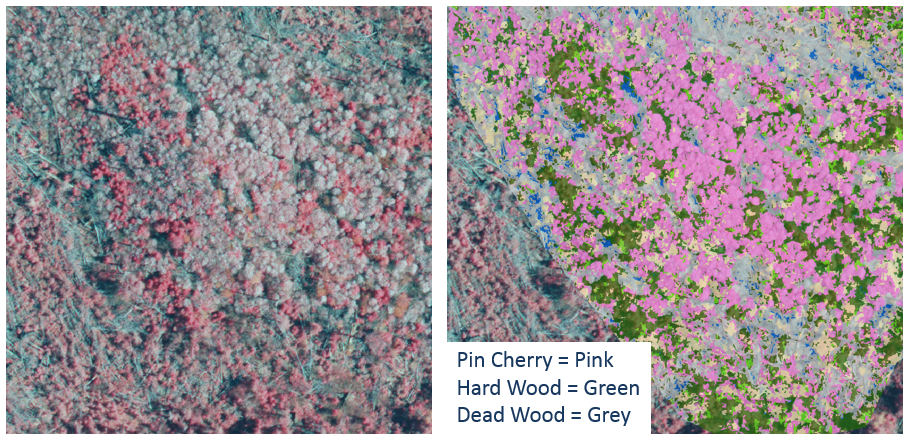
In these images you can see an area that has aspen starting to grow but is not regenerating as densely.
Remote sensing is not an exact science, and using 4 spectral bands versus the 100s a hyperspectral sensor would produce does not generate as much data to analyze. However, by using multiple specifically timed data collections, trained professionals in photogrammetry and ecology can break data down into reliable categories. In this case, the estimated producer accuracies were over 90% and user accuracies over 80%. These rates are higher than MTE foresters felt they may have achieved with a field inventory in this difficult environment.
Using this data, the foresters expect significant savings of time, staff, and money. The data is already being used to identify areas with productive, manageable natural regeneration and areas where foresters will plan to start fresh and re-plant.
MTE’s primary mission is to provide for the Tribe while planning for and maintaining a sustainable forest. Over the course of several decades, they have aggressively pushed advanced management techniques to provide sustained timber yields. This is yet another example of MTE using innovative techniques to achieve that mission.




Recent Comments